It’s true that the longest post-recession economic recovery is still underway in the history of the US. But there are signs that the economy is beginning to slow, and when that happens there will no doubt be an uptick in the number of people who file for bankruptcy. Understanding how bankruptcy statistics have changed and what those statistics mean helps put bankruptcy in perspective for anyone who has or might soon find themselves needing to file.
Bankruptcies Rise for the First Time in Nearly a Decade

The number of bankruptcy filings have fallen every year since the Great Recession peak in 2010. According to the latest data from the US Federal Courts, bankruptcy filings for the 12-month period ending September 30, 2019 increased 0.4% to 776,674 compared to 773,375 at the same point in 2018. But to get a better sense of what’s been happening in the big picture of bankruptcy filings, you have to step back and look at bankruptcy statistics over time.
Big Changes in Bankruptcy Statistics Over Time

The most obvious statistic to look is the total number of bankruptcy filings each year, as assembled from data collected by the US Federal Courts. Here’s one to get us started:
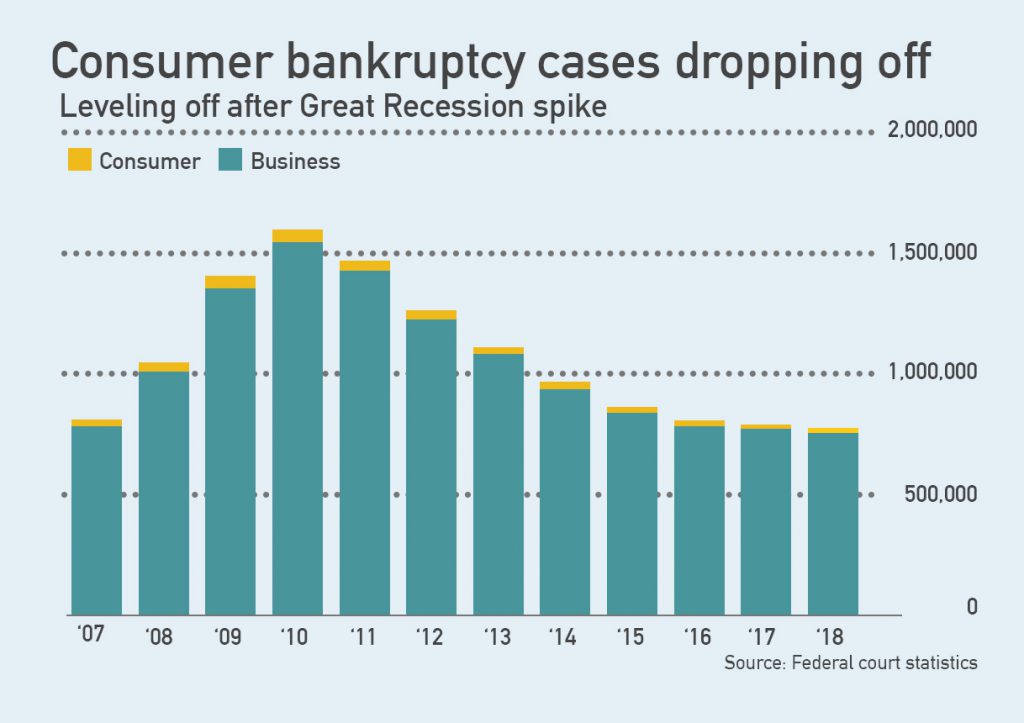
The above chart is a good one to show how a sharp economic downturn can drive up bankruptcy filings. The Great Recession hit in in 2008, so bankruptcies went up sharply that year and the two following years (2009 and 2010). Then the economic recovery got underway, and has continued to be the strongest, longest in US history. But you can also see that the rate of decrease in bankruptcy filings has slowed and leveled off.
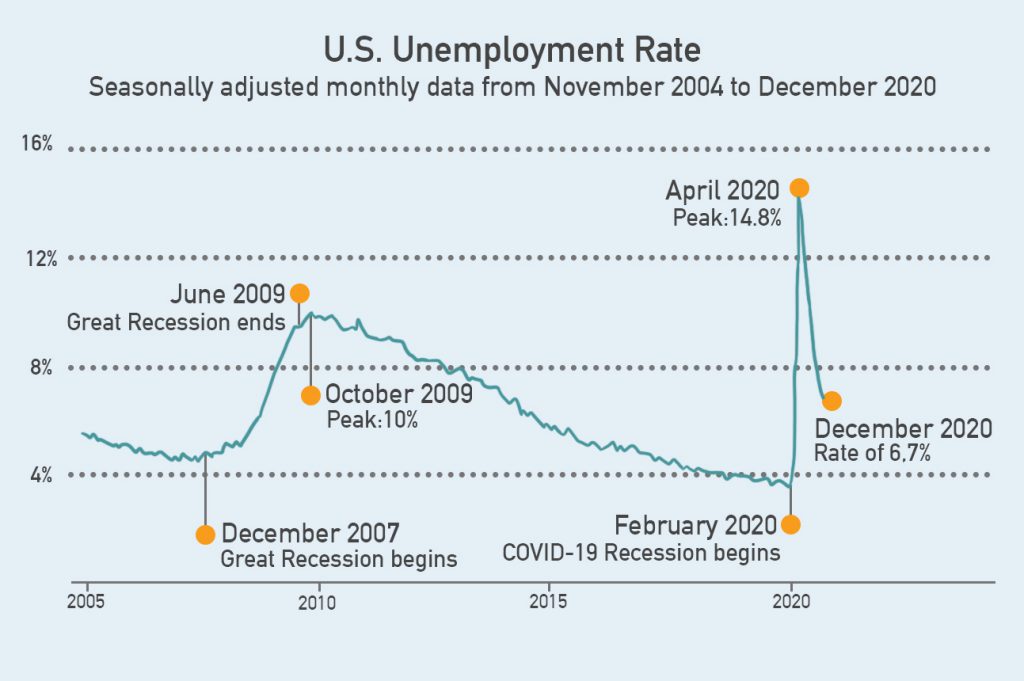
Does this mean we’re on the edge of a new recession? Another downturn is inevitable at some point, and the Federal Reserve has been desperately reducing interest rates in an effort to hold it off (three decreases this year alone after it had raised interest rates four times last year). This relationship between bankruptcy filings and the general economy is best illustrated by taking a look at how unemployment rates changed over roughly the same period of time (2007-2018):
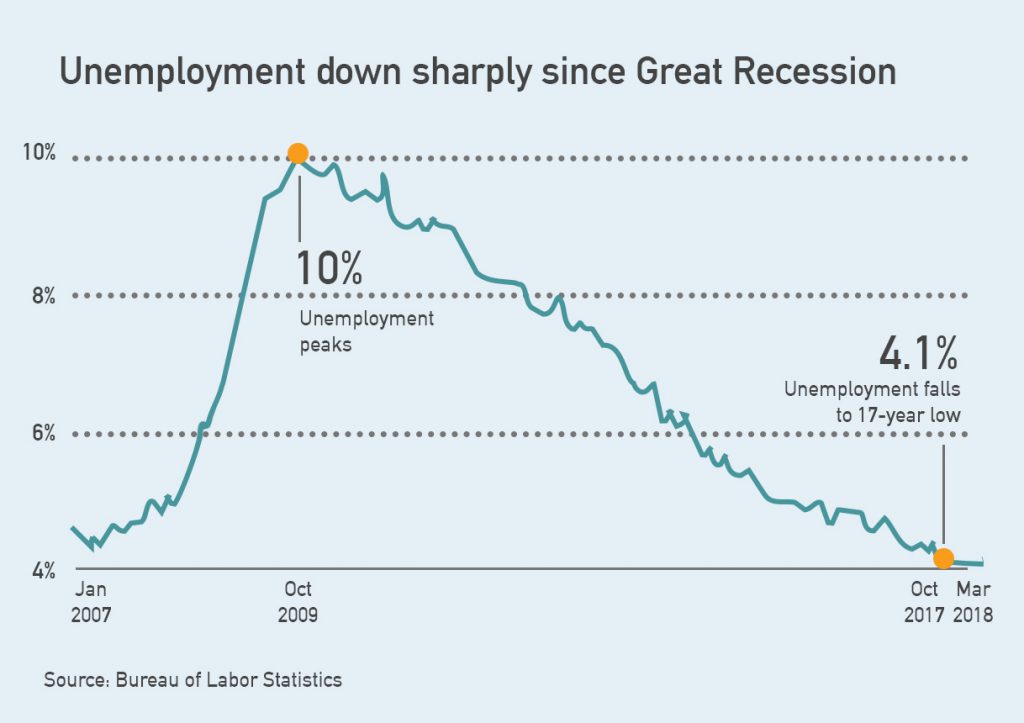
And the unemployment rate has fallen even further since this graph, all the way down to 3.5% in September. Although it’s a line graph instead of a bar graph, you can see how closely the general “shape” of the curve in both charts is basically the same. Clearly, losing a job is a main driver that causes many people to seek relief from bankruptcy laws. But it’s also helpful to take a broader look at these bankruptcy statistics over time, such as the chart below showing business and personal bankruptcy filings since 1987:
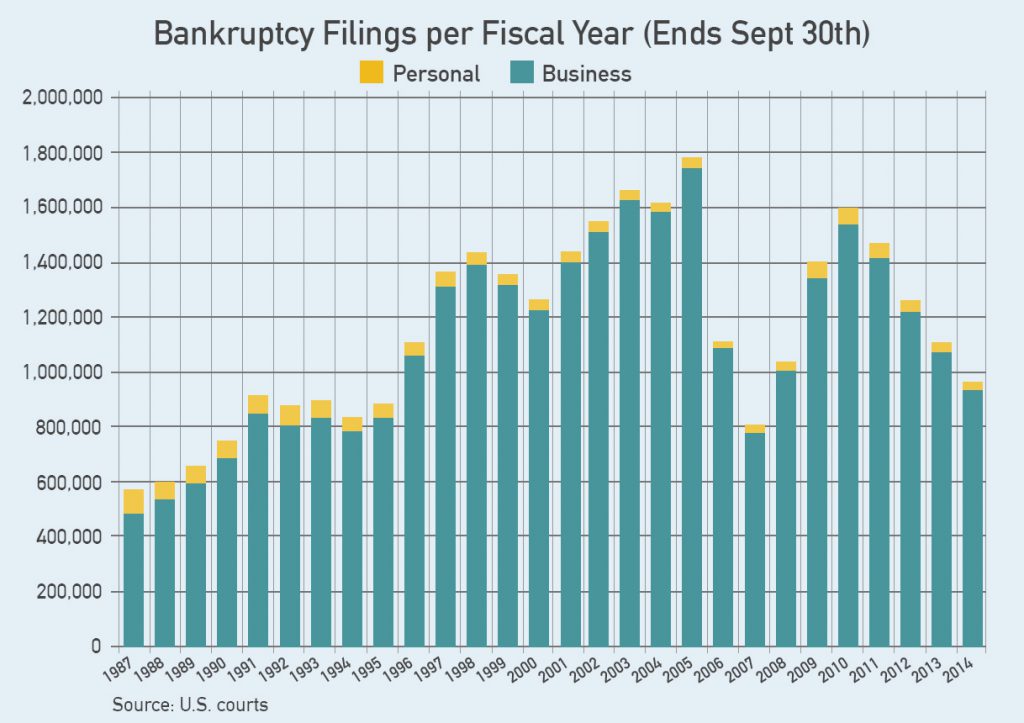
The above graph raises the question of what in the world happened in 2005 to cause such as huge spike in bankruptcy filings. As it turns out, 2005 is the year when major changes were made to US bankruptcy laws. The changes were pushed hard by the credit industry and were all geared towards making it harder and more expensive for people to file bankruptcy.
The spike in 2005 can largely be attributed, in our opinion, to people and businesses who decided to go ahead and file before the changes took effect. This is very revealing because it indicates many people are teetering on the edge of bankruptcy at any given moment. One small thing could push them over the edge such as an unexpected medical expense or home repair not covered by insurance or, in this case, knowing that the laws were about to change. In other words, there are literally millions of people and businesses who could file bankruptcy at any time but don’t for a variety of reasons, such as the stigma associated with it. After all, no one wants to admit financial failure, even when it’s not because of anything they did wrong. The rise in bankruptcy filings over the several years prior to 2005 can probably be attributed to the Dot-Com Crash.
What happens if we back up even further, though, by really zooming out to get the biggest picture possible? If you look at bankruptcy filing data from 1900, it clear that declaring bankruptcy has been on the steady rise pretty much from the beginning, and have skyrocketed dramatically since 1980. The biggest driver of this trend could be described, in our opinion, as “easy credit from greedy creditors.” The revolving lines of credit available to consumers through credit cards didn’t really hit the scene until the last 40 years. Back in 1970 only 16% of households had a credit card – a figure which is over 70% today.
When creditors start playing fast and loose with credit to consumers, things can end up getting out of hand. This is what happened in the Great Recession, largely driven by the housing market where lenders were handing out mortgages like candy – mortgages that simply weren’t sustainable for many consumers.
Other Important Bankruptcy Statistics

While the big-picture bankruptcy statistics of annual filings does give a lot of insight into why things are the way they are today, there are a variety of other figures worth knowing, including the following:
67.5%: The percentage of personal bankruptcies caused by medical bills (source).
204%: The percentage increase in rate of bankruptcy filings of those aged 65+ over 25 years (source). This figure is especially concerning because 10,000 Baby Boomers will continue retiring every day through 2021.
60%: The percentage of people who spend all or more than they earn (source). The problem pointed out by this statistic is that people are not actively saving if they’re spending all or more of their income, which means they have no emergency cushion when something goes wrong, which could trigger a bankruptcy filing.
66%: The percentage of people who would have trouble scrounging up $1,000 in an emergency (source). Like the previous statistic, this one just goes to show how vulnerable to “income shocks” people are. It doesn’t take much to drive people on the edge into bankruptcy.
24%: The percentage of Millennials who demonstrate basic financial literacy. Ouch.
This article has presented our opinion on the debt problems of Americans by taking a look at bankruptcy statistics and related numbers. If you’re in the midst of a bankruptcy filing or recently had one discharged and find you’re in need of financing a car purchase, there are options available to you. Day One Credit works with a network of lenders who have special programs specifically geared towards helping bankruptcy filers get the car they need. Rather than viewing your bankruptcy as some kind of failure, we see it as taking a positive step to getting your financial life back in order and moving forward. A bankruptcy car loan is one way for you to immediately begin rebuilding damaged credit. Learn more in our Bankruptcy Car Loan Guide or get started today with our online application!
At Day One Credit we are experts at finding the best possible bankruptcy car loans in order to help our customers purchase high-quality used cars. We are not lawyers, we do not give legal advice, and nothing we say should be taken as legal advice. Your first step in anything related to bankruptcy should always be seeking the advice and counsel of a qualified bankruptcy attorney.

